Posts

Showing posts from 2017

Transmission Lines and Finals!

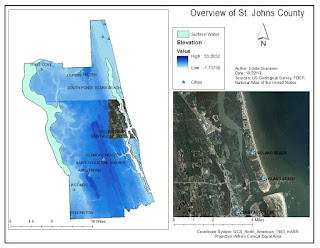
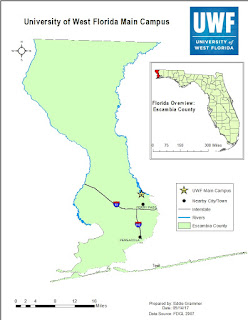
This was a great couple weeks of flexing my GIS muscles! We were working on our final project where I had to investigate the impacts that a transmission line would have in a predetermined area. We were focused on avoiding schools, limiting exposure to environmentally sensitive areas, avoiding as many houses as possible, and figuring a rough estimate of cost. I used a 400 foot buffer on the proposed area for the line to see what lands and buildings might be impacted by the line. I tried my best to use as many tricks that I learned this semester, and I found out that I still have a long way to go. I tried my best to use ArcPy... I wound up just selecting the tools and using them the long way. In the couple weeks off I'm going to check out what codeacademy has to offer for python programming. I also tried using a model to do some of the more repetitive things, but I realized I wasn't quite sure what I wanted done. While it might have saved me some time to use one of those, I had

Georeferencing

Image
This week was all about Georeferencing and using ArcScene. Georeferencing was really cool because you were basically drawing on the map. You trace the outline of a building or just trace a road and then: boom! you have made a new part of the map. I also learned how to edit an attribute table in ArcMap. These were some of my burning questions from the start. like if I was working as a database manager for a city and a new building was built, how exactly would I add it on? Now I know at least one way, and I am sure that there are more ways that I will learn about during some other classes. ArcScene was interesting but I found it hard for it to be informative on it's own. I could see using it in the future to make some sort of graphic aide for a presentation. Here are some of the maps I made this week:

Geocoding and Models

Image
This week was all about geocoding and making models in ArcGIS. Patience was also a big part of this week's work. All in all the process was not too hard, just parts of the geocoding was tedious. All of those parts revolved around the address locator not locating an address. Having to look up the locations on another map and try your best to find that same spot on your own map took quite awhile for some of the locations. On the other hand, making a model took out a ton of the tedious parts of making a map. All the steps that I would normally do were right there in one window and after setting it all up it just took one click and everything was taken care of. I do like working out all of the steps to see my progress, but it was nice not to have to keep up with all of the intermediate data, as the model like to call it, that I usually make. In the long run the model made things more simple, however I still really like fiddling around with the map data and seeing the changes I am mak

Week 10

Image
This week was really cool! I got to use some programming language to run tools in ArcGIS and the process was pretty simple. It was very much like coding something on Codeacademy. Playing with the buffer tool was fun because now I can make areas around a point and have them represent something. Before If I had points I had to make the symbol huge to have the color show. This makes comparing certain attributes easier to visualize on a map. The overlays are really cool and simple to use too. Both of those tools are simple to use, and their names make it easy to decide which one you should use. I also can see how using this tools can be tedious if you have to run them, but you are not quite sure of what you want (like 100m buffer or a 150m buffer). Here's a nice map that I made for a mystery area that highlights some prime campsites.

Week 7 and 8: Data Hide and Seek

Image
This week I was mostly flying solo! It was a little intimidating to search through the two databases to find the data I needed. I wasn't always sure what data I needed or what data I would get when I downloaded it. The public land was the most difficult, everything that I found was way more detailed than what I needed. Eventually after changing my search a few times, I found a general public land file. I thought the projections were going to be difficult, but they were not too bad. It helps to have something with your target projection in ArcMap as you reproject because you can use the "Layer" folder in the tool to pick a projections that is already being used in the map. That way you do not have to root around looking for the projection. This project turned out to by way more interesting and way less frustrating that I expected. Here is what I was able to whip up this past week.

Week 6 - Reprojecting Fun

This week was busy. I was collecting data like Harry Potter collecting Horcruxes. Finding the data is only half the problem, it was mainly just searching two websites, you then have to make sure all the coordinate systems agree with each other. This can be time consuming. When reprojecting data, it works best in a new ArcMap page, just in case something goes wrong. Which reminds me, sometimes things go wrong, and the best way to fix it is to close the map completely and then try again. Some signs of something going wrong while reprojecting include: Looking at the scale and making sure it makes sense (like 1:40,000) 1:2.5 is a bad sign Looking at the coordinate of the cursor in the bottom right hand corner and making sure it updates as you move the mouse around. Also I really liked converting the minutes and seconds to the X/Y coordinates. Next week is the midterm lab, and it takes two weeks! Wish me luck!

Week 5: Projections

Image
This week was a busy one! We started looking into map projections and what the slight differences are between them. The short story is: there are slight differences between each projections, some things will be smaller and some will be bigger depending on what projection you are using. What's the correct projection? Who knows! It would change based on what the range of your map will be, what the project calls for (if you're making a map for someone) or even personal preference. One of my questions was also answered: what to do if someone does not have all of the data it needs. I had to add something that did not have a coordinate system defined. The good news is that it can be assigned in ArcGIS. The bad news is that it is basically a guessing game. Overall, this was a very enlightening week and I look forward to the rest of the projections lesson. Here's a neat map that compares three different projections.

Week 4: Sharing is Caring

No picture this week, only a link to my map: http://www.arcgis.com/home/item.html?id=5708de30779a4a3694760c2933bafe48 This week I played around with different ways to share maps as well as making my own data. I came up with the Top Ten Things to Do in Orlando, seeing as I have lived here for more than 20 years, I feel that I am some sort of an expert. After coming up with the list, I added the most important information to an excel spreadsheet and then uploaded that to ArcGIS online. I was pretty surprised to see there wasn't any other special program to make the data I needed for a map. To share the data, I practiced exporting to ArcGIS Online, making map packages, and creating a google earth map. The google earth map was my favorite and it seems like a solid choice to use when giving something to someone who isn't familiar with GIS. Overall, this was a great week that answered my biggest question: how do you make points on a map if no one else has ever done it.

Week 3: Cartography

Image
This was a pretty big week: I made three maps! It was actually really easy to make three different maps once the base layer was made. I saw the ArcCatalog this week and it was much easier to look through the metadata for the files in ArcCatalog as opposed to right-clicking each of the files in the table of contents and finding the data there. I had some trouble with labels, they were sometimes hard to read or they made the map feel cluttered, at least to me. There was a part in this lab where there were limited directions and I was on my own. After double left clicking and right clicking some things, I was able to set up the map; time will tell if I set it up correctly, but it was set up. I liked being able to stretch my wings a little and figure out how to set up the elevation on my own. It was really satisfying to find all of the settings on my own. Here are the maps that I worked so hard to make.
Image
This week was a real whirlwind! After figuring out that I was getting my data from the wrong place, I was able to make this week's map. I thought it was really cool making the insert map! This product almost looks professional! There were lots of little details when it came to changing symbols and labels: some things you have to double click and some things you have to right click. After navigating through all of that, I was able to get all of the essential map elements. All-in-all, the big parts: making the insert map, adding the data, and arranging the elements was easy; formatting all of the small details was the most tricky part, but after reading the manual and clicking around everything seems to have come together. Excluding the hurricane, this was a great week, and I am looking forward to week three!
Image
Week 1: ArcGIS Overview Lab This project was a real treat for someone who enjoys poking around new programs and figuring them out. The directions for the lab were straight forward and made making the map super easy. If I ever got stuck there was a handy screen shot to guide me. The program seems pretty easy to pick up: the controls are right on the tool bar and you don't have to hunt, the names of the tools are pretty self explanatory, and there are multiple ways of getting help. This map seems pretty simple. The data was collected from the USGS, and it shows the world, compares the populations of all of the countries and shows where some major cities are. I am really looking forward to the next project!